


Notebooks

Categories


Cells
Premium


BioTuring
Spatially resolved gene expression profiles are key to understand tissue organization and function. However, spatial transcriptomics (ST) profiling techniques lack single-cell resolution and require a combination with single-cell RNA sequencing (scRNA-seq) information to deconvolute the spatially indexed datasets.
Leveraging the strengths of both data types, we developed SPOTlight, a computational tool that enables the integration of ST with scRNA-seq data to infer the location of cell types and states within a complex tissue. SPOTlight is centered around a seeded non-negative matrix factorization (NMF) regression, initialized using cell-type marker genes and non-negative least squares (NNLS) to subsequently deconvolute ST capture locations (spots).
Simulating varying reference quantities and qualities, we confirmed high prediction accuracy also with shallowly sequenced or small-sized scRNA-seq reference datasets. SPOTlight deconvolution of the mouse brain correctly mapped subtle neuronal cell states of the cortical layers and the defined architecture of the hippocampus. In human pancreatic cancer, we successfully segmented patient sections and further fine-mapped normal and neoplastic cell states.
Trained on an external single-cell pancreatic tumor references, we further charted the localization of clinical-relevant and tumor-specific immune cell states, an illustrative example of its flexible application spectrum and future potential in digital pathology.

BioTuring
Build single-cell trajectories with the software that introduced **pseudotime**. Find out about cell fate decisions and the genes regulated as they're made.
Group and classify your cells based on gene expression. Identify new cell types and states and the genes that distinguish them.
Find genes that vary between cell types and states, over trajectories, or in response to perturbations using statistically robust, flexible differential analysis.
In development, disease, and throughout life, cells transition from one state to another. Monocle introduced the concept of **pseudotime**, which is a measure of how far a cell has moved through biological progress.
Many researchers are using single-cell RNA-Seq to discover new cell types. Monocle 3 can help you purify them or characterize them further by identifying key marker genes that you can use in follow-up experiments such as immunofluorescence or flow sorting.
**Single-cell trajectory analysis** shows how cells choose between one of several possible end states. The new reconstruction algorithms introduced in Monocle 3 can robustly reveal branching trajectories, along with the genes that cells use to navigate these decisions.

BioTuring
Mapping out the coarse-grained connectivity structures of complex manifolds
Biological systems often change over time, as old cells die and new cells are created through differentiation from progenitor cells. This means that at any given time, not all cells will be at the same stage of development. In this sense, a single-cell sample could contain cells at different stages of differentiation. By analyzing the data, we can identify which cells are at which stages and build a model for their biological transitions.
By quantifying the connectivity of partitions (groups, clusters) of the single-cell graph, partition-based graph abstraction (PAGA) generates a much simpler abstracted graph (PAGA graph) of partitions, in which edge weights represent confidence in the presence of connections.
In this notebook, we will introduce the concept of single-cell Trajectory Analysis using PAGA (Partition-based graph abstraction) in the context of hematopoietic differentiation.

BioTuring
The development of immune checkpoint-based immunotherapies has been a major advancement in the treatment of cancer, with a subset of patients exhibiting durable clinical responses. A predictive biomarker for immunotherapy response is the pre-existing T-cell infiltration in the tumor immune microenvironment (TIME).
Bulk transcriptomics-based approaches can quantify the degree of T-cell infiltration using deconvolution methods and identify additional markers of inflamed/cold cancers at the bulk level. However, bulk techniques are unable to identify biomarkers of individual cell types. Although single-cell RNA sequencing (scRNAseq) assays are now being used to profile the TIME, to our knowledge there is no method of identifying patients with a T-cell inflamed TIME from scRNAseq data. Here, we describe a method, iBRIDGE, which integrates reference bulk RNAseq data with the malignant subset of scRNAseq datasets to identify patients with a T-cell inflamed TIME.
Utilizing two datasets with matched bulk data, we show iBRIDGE results correlated highly with bulk assessments (0.85 and 0.9 correlation coefficients). Using iBRIDGE, we identified markers of inflamed phenotypes in malignant cells, myeloid cells, and fibroblasts, establishing type I and type II interferon pathways as dominant signals, especially in malignant and myeloid cells, and finding the TGFβ-driven mesenchymal phenotype not only in fibroblasts but also in malignant cells.
Besides relative classification, per-patient average iBRIDGE scores and independent RNAScope quantifications were utilized for threshold-based absolute classification. Moreover, iBRIDGE can be applied to in vitro grown cancer cell lines and can identify the cell lines that are adapted from inflamed/cold patient tumors.
Trends
BioTuring
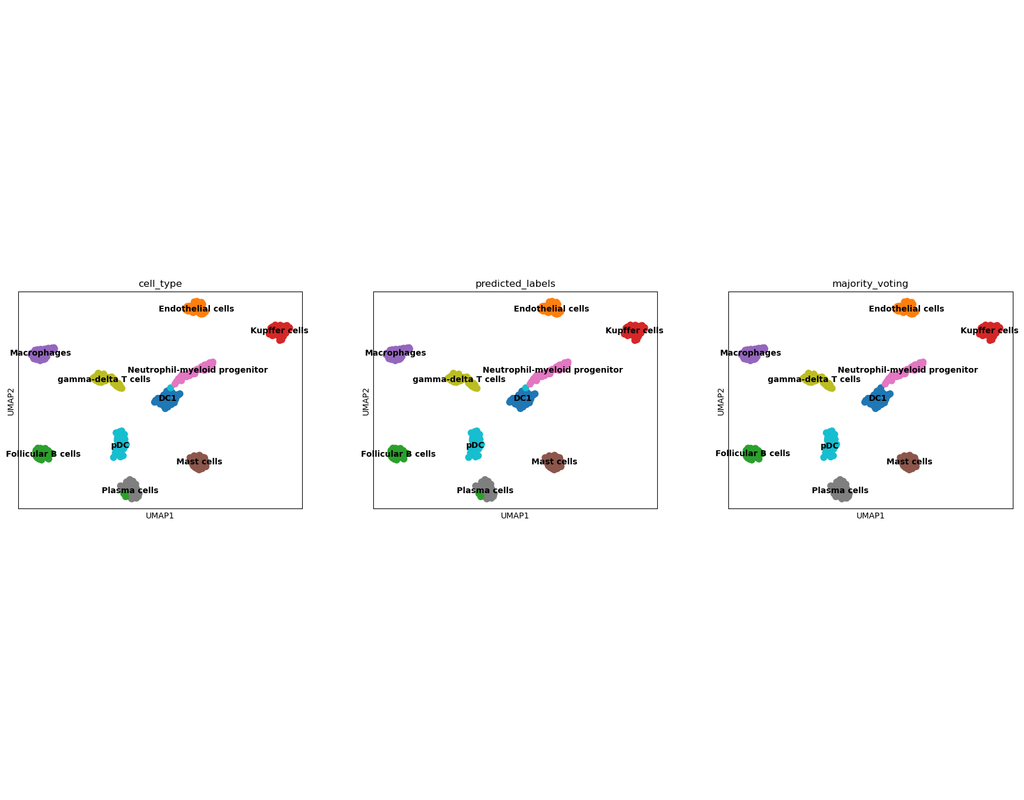
CellTypist is an automated cell type annotation tool for scRNA-seq datasets on the basis of logistic regression classifiers optimised by the stochastic gradient descent algorithm. CellTypist allows for cell prediction using either built-in (with a current focus on immune sub-populations)or custom models, in order to assist in the accurate classification of different cell types and subtypes.
CellTypist can identify 101 cell types or states from more than one million cells, including previously underappreciated cell states.
For the CellTypist pre-trained models, immune cells from 20 tissues of 19 studies were collected and harmonized into consistent labels. These cells were split into equal-sized mini-batches, and these batches were sequentially trained by the l2-regularized logistic regression using stochastic gradient descent learning. Feature selection was performed to choose the top 300 genes from each cell type, and the union of these genes was supplied as the input for a second round of training.